Create Chart from Crosstab
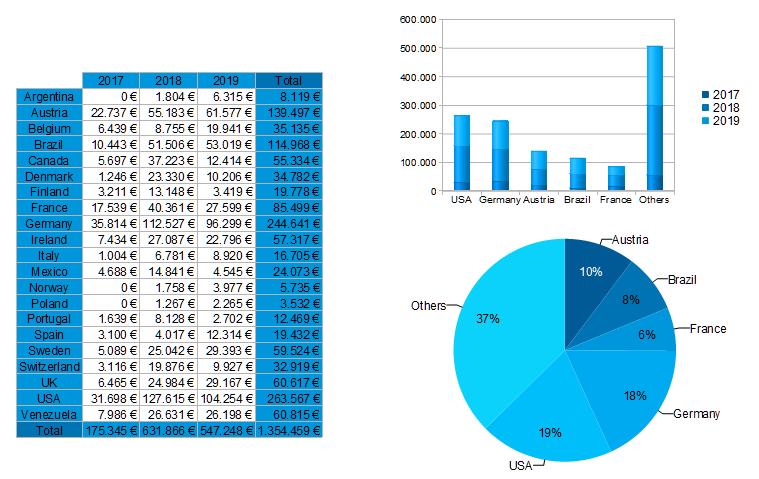
Crosstabs and charts have a lot in common. Therefore, you can use the function 'Copy As' in the context menu or in the menubar 'Crosstab' to convert or copy a cross-table into a Circle Chart, Bar Chart or Line Chart.
With Circle Charts, of course, you only have 2 axes available, which is why a Bar Chart or Line Chart is probably more suitable. After applying some optimizations, such as sorting the data by value and specifying a limit to a few entries, you will get the desired chart.

Figure 6.33: Conversion of cross table to chart