Variable/Field List and Drag & Drop
The variable/field list (Project > Variables/fields) shows all variables and fields available in the current project and supports drag & drop for variables and fields.
* When you drag variables to an empty area, a paragraph will be created in a new text object.
* When you drag variables to an existing text object, the variable can either be inserted into an existing paragraph, or a new paragraph can be created.
* When you drag fields into an existing report container, a new table will be created.
* If you wish to add additional columns for existing rows in tables, you can simply drag the desired fields from the list to the corresponding location using your mouse. In this case, the field can be added to the left or right of an existing column; the insertion position is indicated visually with the help of a symbol. The column (default width 30 mm) will then be inserted in the corresponding row. Note that this may also create columns in invisible areas.
* For numerical fields, this also automatically creates a footer with sums. If you do not wish to create a footer, hold down the CTRL key.
* If you have selected multiple fields, the order of the selection will be remembered and the fields will be placed in the corresponding order.
* When you drag fields to an empty area, a new table will be created in a new report container.
* When you drag fields into an existing report container, a new table will be created.
* When you drag fields from a relationally linked table to an existing table (e.g. fields from "Orders" to the table "Customers"), a new sub-table will be created.
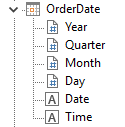
* If you drag fields to an existing cross table, a new grouping or results cell is created. Of course, you can also drag the formula variables below the fields directly to the cross table, e.g. as a grouping for the year of a purchase order. You can also add further groupings (for example, by quarter) below or above this grouping using drag and drop.

Figure 3.19: formula variables
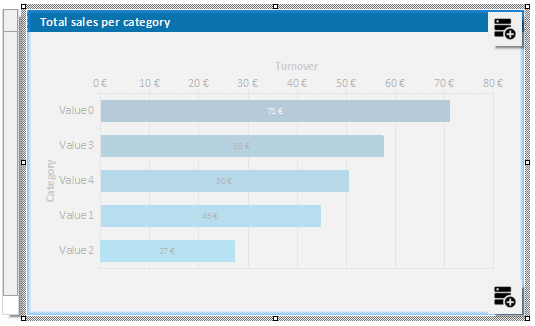
* If you select the report container, you can drag and drop one or more fields onto the black areas at the top right and bottom right to automatically create a table or cross table as the first or last entry in the report container.

Figure 3.20: Black buttons for drag & drop on tables/cross tables